
During development, debugging your application can be very useful in determining the location of defects, evaluating expressions and understanding the overall flow of the application. Your AEM application may consist of many Models, Services, or Servlets and you have the ability to set breakpoints in each.
To debug your application, run the command below in your terminal to start AEM with the proper debug options set:
java -XX:MaxPermSize=512m -Xmx2048M -agentlib:jdwp=transport=dt_socket,address=4502,server=y,suspend=n -jar ${PATH_TO_JAR} -p 4502Next, open IntelliJ and create your debug configuration.
- Click the Run Tab in the IntelliJ toolbar and select “Debug”
- In the Debug Options Window, select Edit Configurations.
- Add a new configuration by clicking the “+” in the top left hand corner.
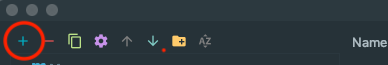
4. Select “Remote” and a new configuration will be added.
5. Select the new Configuration and edit the properties to match your AEM instance.
6. Add this command line to the “Command Line Arguments” Section in your configuration.
Address should be the port number your AEM instance is running on.
-agentlib:jdwp=transport=dt_socket,server=y,suspend=n,address=4502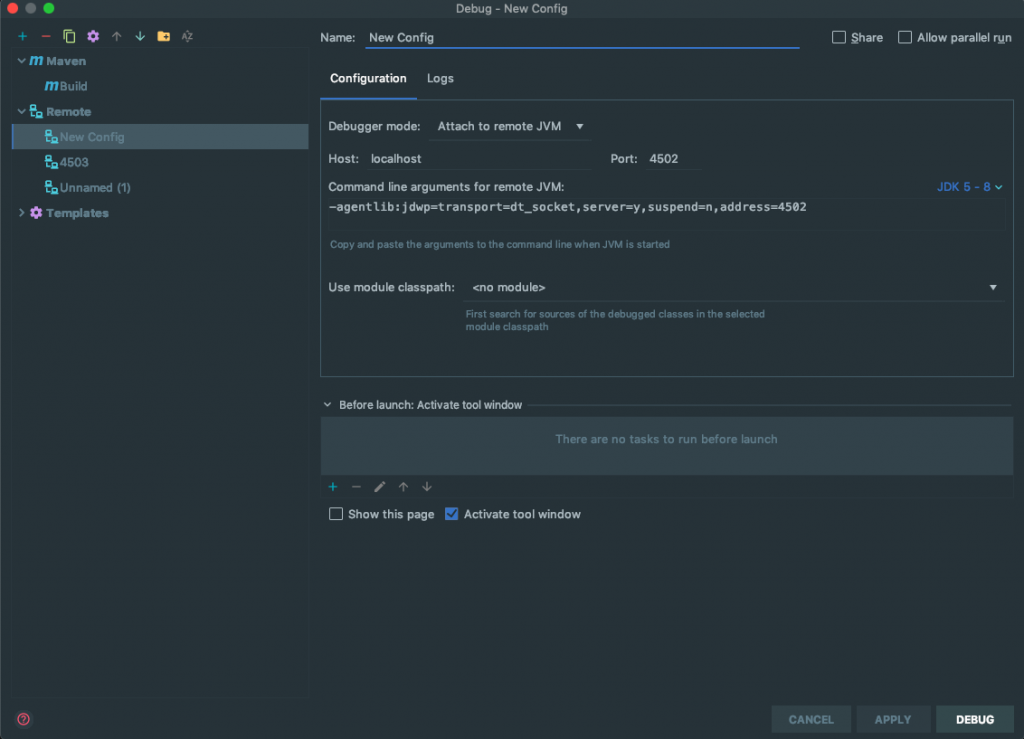
7. Click apply and then Debug. A new window should open with a message saying that you are Connected to the debugger.
If you aren’t able to connect, try restarting your AEM instance. The debugger can only be connected after the AEM Instance is started.